Let’s take the long view of the current market and its value – and then ask how it affects your portfolio and what (if anything) you should do about it.
| A Quick Note It is all about the economy stupid! Things have been slowing for a while. The labor market, a trailing indicator, is starting to show the cracks. Especially with the recent job revisions, adjusted down by 818,000 jobs. Everyone is hoping for a soft economic landing but that is very difficult to do. The Federal Reserve will start to cut interest rates to combat the slowing economy, but will that reverse the trend? It appears that the market has gotten over its skis once again. The market has already priced in multiple interest rate cuts. If that doesn’t happen, the market will give back the recent profits. Even if they cut rates, if we tilt into a recession, rate cuts won’t matter and the market will fall. Why? The market is based on corporate profits. If a recession reduces profits, stocks will suffer. So it is a wait and see game. Currently the market has had decent momentum. That can change quickly. Please read on for a game plan to combat that. |
Please see the graph below. The market value in the graph is based on the work of a Nobel Prize winner, Warren Buffet and a handful of others.
If you are getting close to a goal (needing to withdraw from your investment accounts) review your portfolio risk allocation to make sure you can stomach and afford to ride out the next bear market.
If you are more active with your investments, ride the wave but have your defense ready. That is our approach.
What can I learn from stock market valuation?
Well, in the short term, nothing! But in the long-term, it is amazingly predictive of where the market will be at the end of seven to ten years. It’s like knowing the answers to the test, but not the exact day it will be given.
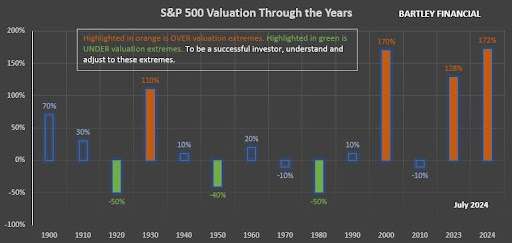
The above graph is the average of Crestmont Research, Shiller Cyclical P/E 10, Q Ratio, S&P Composite from its Regression–all geometric mean (source: dshort.com). In addition, the GMO Investment Management 7-Year Asset Class forecast for US Large Cap stock (GMO.com), Buffet Indicator (dshort.com), and John Hussman, PhD Hussman Strategic Advisors’ market value calculation, (hussmanfunds.com) were added to the average.
The graph above shows the highest overvaluation in history, approximately 200% overvalued. The average or “fair” value is 0%. Please note that one of the valuation methods included in the average is Yale economist Robert Shiller’s Cyclical P/E 10 valuation measurement, which tracks valuation back to 1871. Shiller won a Nobel Prize in 2013 for his work on asset valuation.
An easy way to ascertain stock values on your own is to review dividend yields. The average historic dividend yield for stocks is 4+%. Currently dividend yields are about 1.5% for the S&P 500 index, which tells you that stocks are more than double their fair value, which mirrors the average of the valuation measures in the graph above.
How does the stock market valuation relate to my portfolio?
Stock market valuation is the BEST indicator of future stock market performance. Therefore, the current market extreme overvaluation requires a proactive strategy for your portfolio. If you will not need the money in your portfolio for many years, such as your children’s education or retirement, then you have to be less concerned than if you need the money sooner. For example, if you are within 10 years of needing the money for education or within 15 to 20 years of retirement, then you should definitely consider adjusting your portfolio allocation. Why? Because the average bear market loss is 50%. How much and when the stock market will fall is anyone’s guess. But it’s clear that the stock market will fall, or regress to the mean. Say you experience the average bear market loss of 50%, or more. I note “more” because there have been times when the bear market losses have been greater than 50%, especially for the more aggressive sectors of the economy such as technology. If you suffer a large bear market loss, how much would you need to recover? It would require a subsequent gain of 100% – or more.
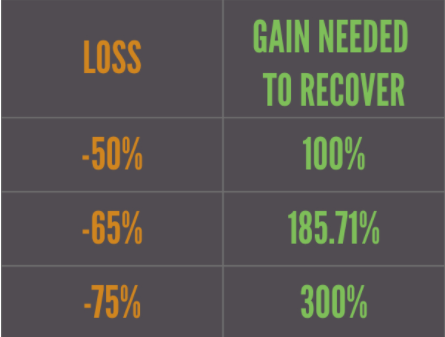
Don’t fret: if history is a guide, the market will recoup its losses and some! The stock market has easily been the best place for your money long-term. The issue is that it takes many years to dig out of the bear market hole.
So what should my investment game plan be?
The key in this market is to attempt to make money but not lose your shirt in the process. We recommend that your investment approach takes value or value extremes into consideration. You can also use the market’s momentum if you are more aggressive and have more time to attend to your investments.
The venerable Jack Bogle, founder of Vanguard, proposed allocating your current age to bonds or conservative investments (e.g. at age 50, you would have 50% in bonds and 50% in stocks or risk assets). This is a fine strategy but too simplistic when you are getting closer to your goal–when you need the money. Jack’s approach will still subject you to large losses in a bear market (e.g. 50% in stocks or risky assets x 50% bear market loss equals a 25% portfolio loss, or a $250,000 loss on a million-dollar portfolio). In addition, you will leave a lot of money (gains) on the table when you have a large allocation to bonds but the market value is low and poised for a long bull market run. Why not move your risk allocation as the market becomes overvalued and the downside risk is steep?
The goal is to protect principal but also share in the gains when an asset class (US stocks, foreign stocks, real estate, commodities, bonds, cash, and others) is performing well. Your portfolio growth will be far greater if you avoid large losses so you have more money to grow when the market provides sustainable gains. This is the case even if you experience small or no gains before the market slide. I often point out that a portfolio that experiences large gains and large losses fares much worse than a portfolio that experiences no or nominal gains at the top of a market, avoids larger losses, and then shares in strong upside rallies. *
OK, but SPECIFICALLY how do I do this?
You can adjust your allocation to risk (stocks, real estate, commodities, and poor-quality bonds) based on the market over- or undervaluation. For example, if the market is 50% overvalued and your target risk is 60%, then you would reduce it to 30%. If the market is undervalued by 30% you should consider increasing your risk allocation to ~80%. Please understand, using history as a guide, when the market is at extreme highs like today the downside risk of significant loss is substantial, e.g. 60% in risk assets equals a 30% loss. However, when the market is at fair value or undervalued the downside risk is not as extreme.
The momentum option is for more aggressive investors who do not want to be as conservative in an overvalued market. Rather than reducing your portfolio allocation to risky assets, you can use the market’s momentum to ride the stock market advance until the trouble starts. You have to have strict rules on loss mitigation, such as using stop losses or comparable loss minimization techniques.
Regardless of your approach, the key is that you are disciplined in implementing it. If you rely on emotions and not on your investment discipline, you will not succeed–and you are likely to become very frustrated.
We continue to watch closely for risks and opportunities and will keep you posted.
Call us and we can help you make more sense of this, happy to help. We are believers in the free and open flow of information. We should be taught this in school. It is essential information for your life/future. Please visit our Financial Literacy page for more information on personal finance, please share it with a young person. If their parents didn’t teach them about this, they didn’t receive this necessary education!
“If everyone is thinking alike, then no one is thinking.” – Benjamin Franklin
*Past performance is not indicative of future results.
Need Help?
Bartley Financial is built around a client-first ethos. We are as committed to exhibiting high levels of professionalism as we are to building relationships with clients built on trust and mutual respect. That’s why we hold ourselves to a fiduciary standard. It’s also why we offer a transparent, fee-only compensation structure so that our clients never need to be concerned about a conflict of interest.
Bartley Financial has an experienced team of CPAs and CFPs® (Certified Financial Planners®) dedicated to helping clients manage their investment portfolios, plan for retirement, strategize taxes, or execute any other initiatives in pursuit of optimum financial health and minimal financial stress. From our offices in Andover, MA, and Bedford, NH, we work to ease clients’ financial concerns, strengthen their portfolios, and assuage their worry that they don’t know what they don’t know.
Contact us today to begin a relationship with a team of knowledgeable, trustworthy professionals who put their clients first.
By Robert Bartley
Robert Bartley creates the vision for the team. Everything we do centers on the clients we are fortunate to work with. Robert always says “it’s not difficult to work hard for our clients when they are such impressive people that inspire us!” Robert is also the inspiration for BFA’s work ethic which he attributes to his parents and growing up at his family’s restaurant. Robert is always pushing the team to sharpen our skills for the benefit of our clients. He is tenacious in our collective pursuit of mastery as individuals and as a team, but understands that it is a life-long journey that is never complete.