I am going to touch on various topics regarding the markets and economy. You can jump to those sections here:
Economic Slowdown and Investment Risk
How should you position your portfolio to weather an economic downturn?
Recent Market Action
The underpinnings of the economy are worrisome. Keep riding the stock market wave but be sure to pull out before the wave crashes! However, the market may be a bit bumpy as it figures out its way.
The stock market, as a whole, had a great end of the year, a very nice Santa Claus rally. January, as expected, started off slow, however things have shifted in the last couple of weeks. We may be back to a handful of technology stocks leading the way. This may be a head fake but some of the best performance year to date has been in the technology (e.g. Microsoft and NVIDIA) and communication services (e.g. Meta and Netflix) sectors. These big companies dominate the S&P 500 (the one we hear/see on the financial updates – weighted by size of company or capitalization weighted) up about 4% year to date through the first couple of days of February versus the S&P 500 Equal Weighted (each stock is equally weighted despite company size, i.e. 1/500) which is up only 0.22% for the same time period.
This domination of performance by a handful of large technology-related companies is a continuation of last year. This is eerily similar to the top of other markets, i.e. the late 1990’s and the .com bubble, Or the Nifty Fifty in the 1970’s before the large downturn in the early 1980’s. The thinking is that these large companies can do no wrong, profits to infinity! The problem is, profits ebb and flow, they are never straight up or down.
The beauty of the upswing of the market has been that algorithmic computer trading has helped the upside momentum, but the algorithm bringith up and down. Please read through to the last section of this article How should you position your portfolio to weather an economic downturn for strategies to make sure your portfolio is ready for all types of markets.
Residential Housing Market
Still broken due to the low inventory problem.
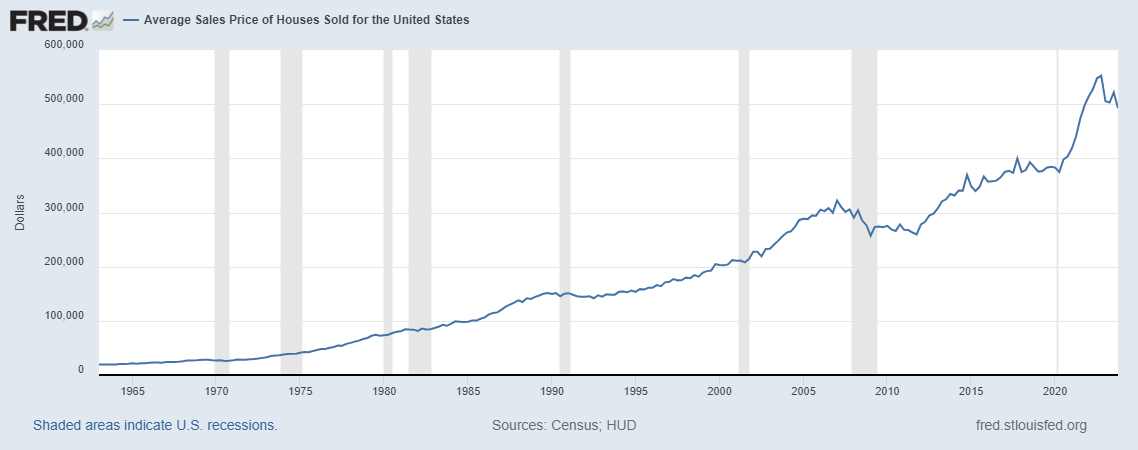
The graphs below show how far above trend we have been since the pandemic spike. If you would like to see some relief in prices, fear not, the reversion to the trend is a powerful force. I hope this bodes well for those priced out of the real estate market.
Average home sales price – were $521,900 last summer, moved down to $492,300 in October 2023, the last reported number.
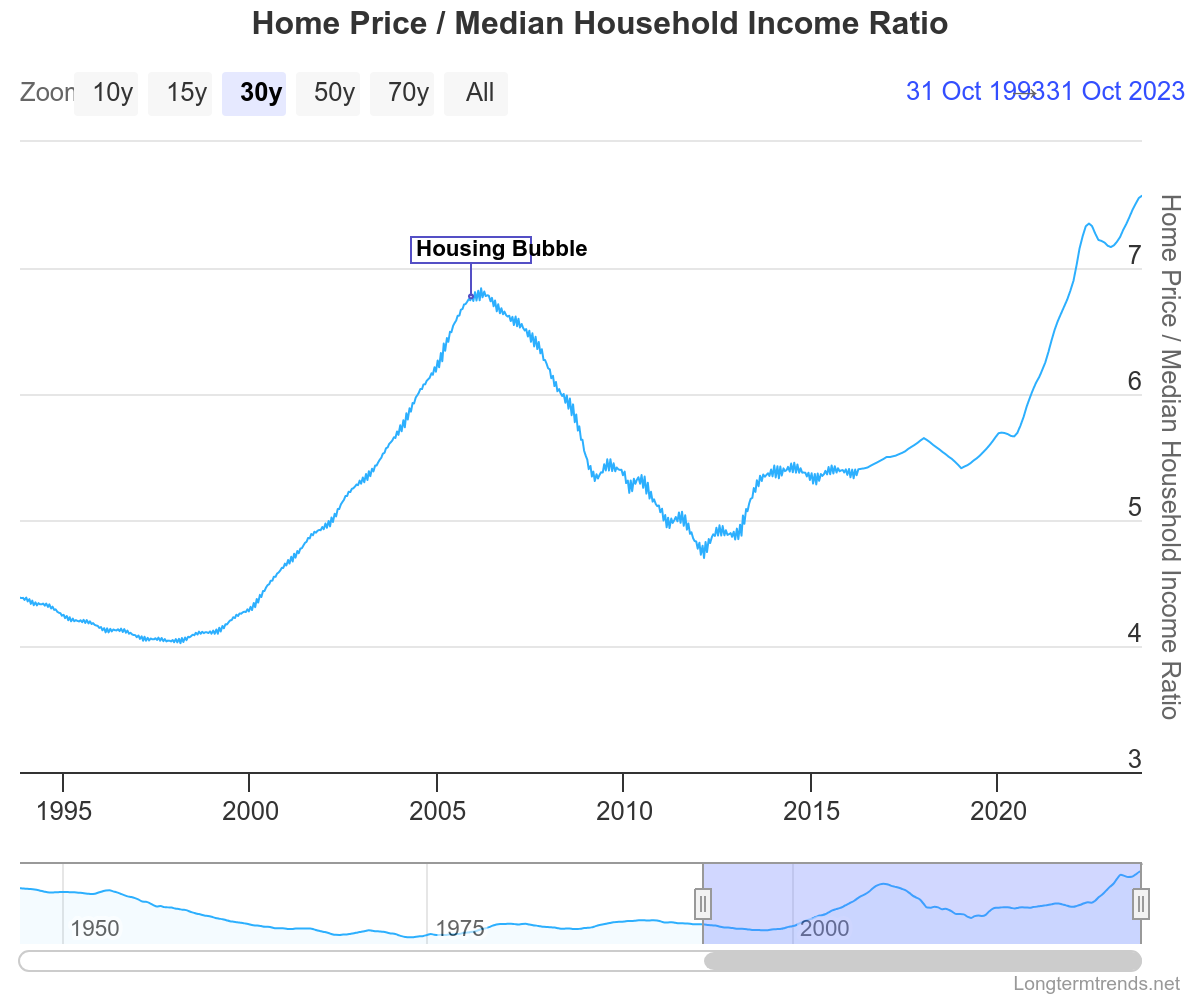
Obviously lower prices would be welcomed by many trying to enter the market. House prices have become beyond the reach of many. The cost of home ownership as a percentage of gross income has significantly increased as shown in the graph below. We have far surpassed the housing bubble of 2005-2008.
Demand is still high due to very low inventory. One of the reasons is the current higher mortgage interest rates are locking homeowners into their property.
There have been many articles written about the lack of building enough new homes after the mortgage crisis and Great Recession. However, it is not the only issue. Corporate investors/flippers and Airbnb, VRBO, etc have increased prices, especially in resort areas. Airbnb has also had an impact in residential neighborhoods by reducing homes available for owner occupants or renters.
The charts above show that the spike in home prices is unsustainable. It is impossible to know how this unravels but an economic slowdown which puts sellers in distress will go a long way to bringing prices down.
The Federal Reserve has broken the residential housing market with the forever low interest rates and backing the mortgage market. Let the market do its thing so younger and lower income earners can afford a house.
Economic Slowdown and Investment Risk
Hoisington Investment Management’s latest Quarterly Review and Outlook paints a worrisome picture. They note that for just the 8th time since 1929, the 2023 Federal budget deficit exceeded private and foreign savings. The previous 7 times occurred during the Great Depression and the Great Financial Crisis recession. This is obviously not a good sign. The recent government spending excesses will impede future growth.
The Leading Economic Indicators (LEI) index remains deeply negative. The indicator has recently turned up slightly, soft landing? With all the excess debt and negative Gross Domestic Income, we may be in a slow or negative growth economy for a while.

The yield curve is still negative (the slope of the line in the graph is usually up). This generally portends a recession, not yet this time.
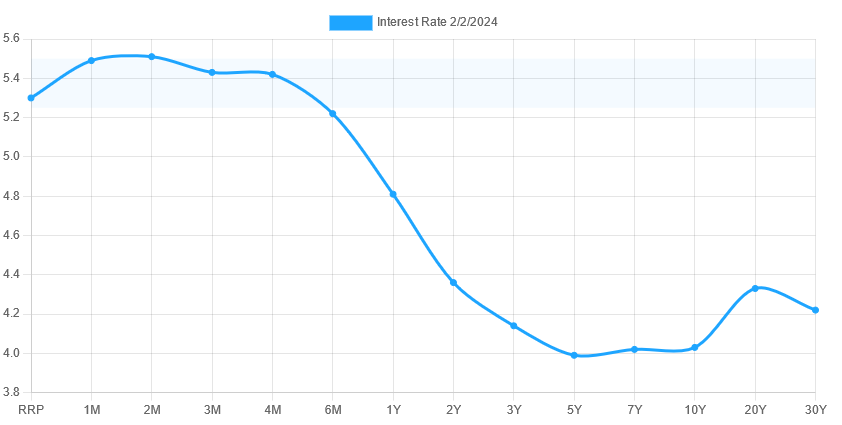
Source : https://www.ustreasuryyieldcurve.com/
Keep an eye on the stock market. The market generally turns down six months before a recession.
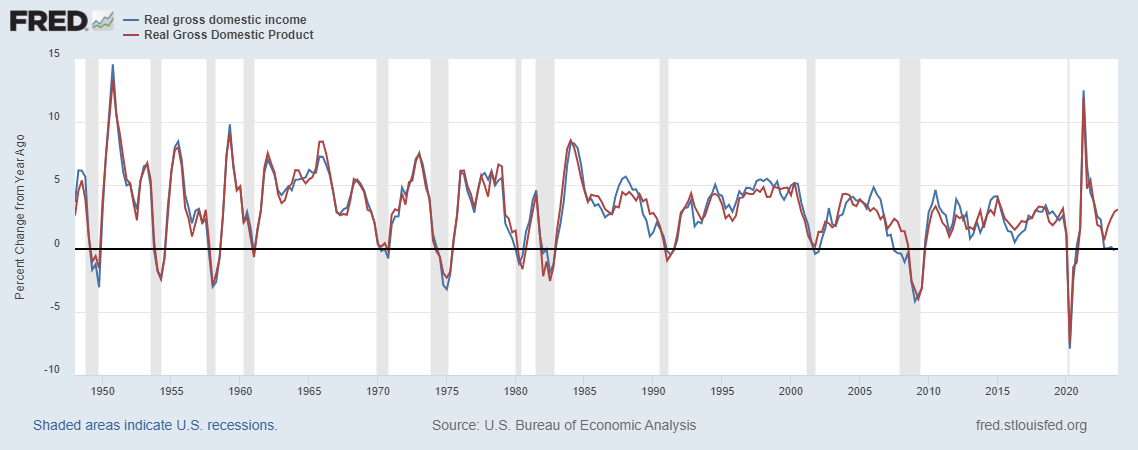
Gross Domestic Income (GDI) and Gross Domestic Product (GDP) usually move together. As you can see from the chart below, GDI is showing recession but GDP has turned up. We will have to wait for this to work itself out. It is not encouraging that GDI has fallen to a recession level.“Real” (or inflation adjusted) GDI measures what the economy makes on wages, profits and taxes. It does make sense that when adjusted for inflation, income is low, in the recessionary range.
Real Gross Domestic Income (GDI) and Product (GDP) – GDI is negative
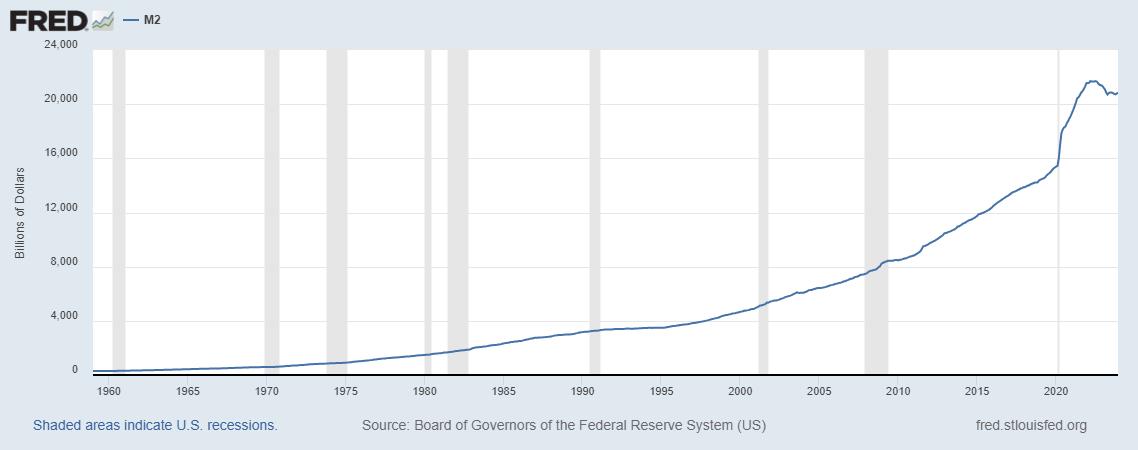
The Money Supply had been shrinking (recessionary) but has leveled off.
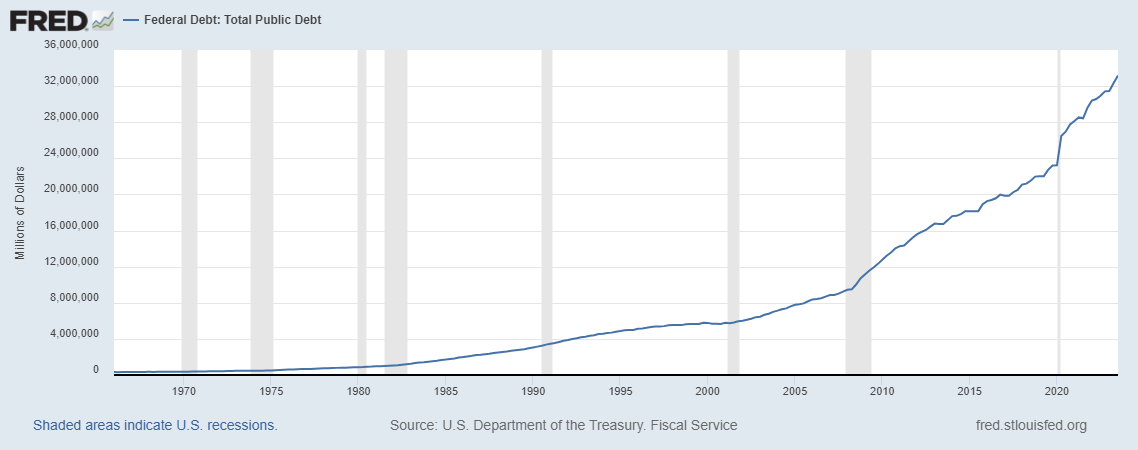
Total Public Debt continues to grow and spiral out of control. This will continue to slow growth. Why? – because goods and services bought today with debt will obviously have to be paid back later. This will result in higher taxes (less money for consumers to spend). We had a party (or the politicians did) and our kids and grandkids will have to pay for it.
Total Public Debt – now well over $33 trillion (July 2023 last reported) – please make them stop!
What is the investment risk ahead?
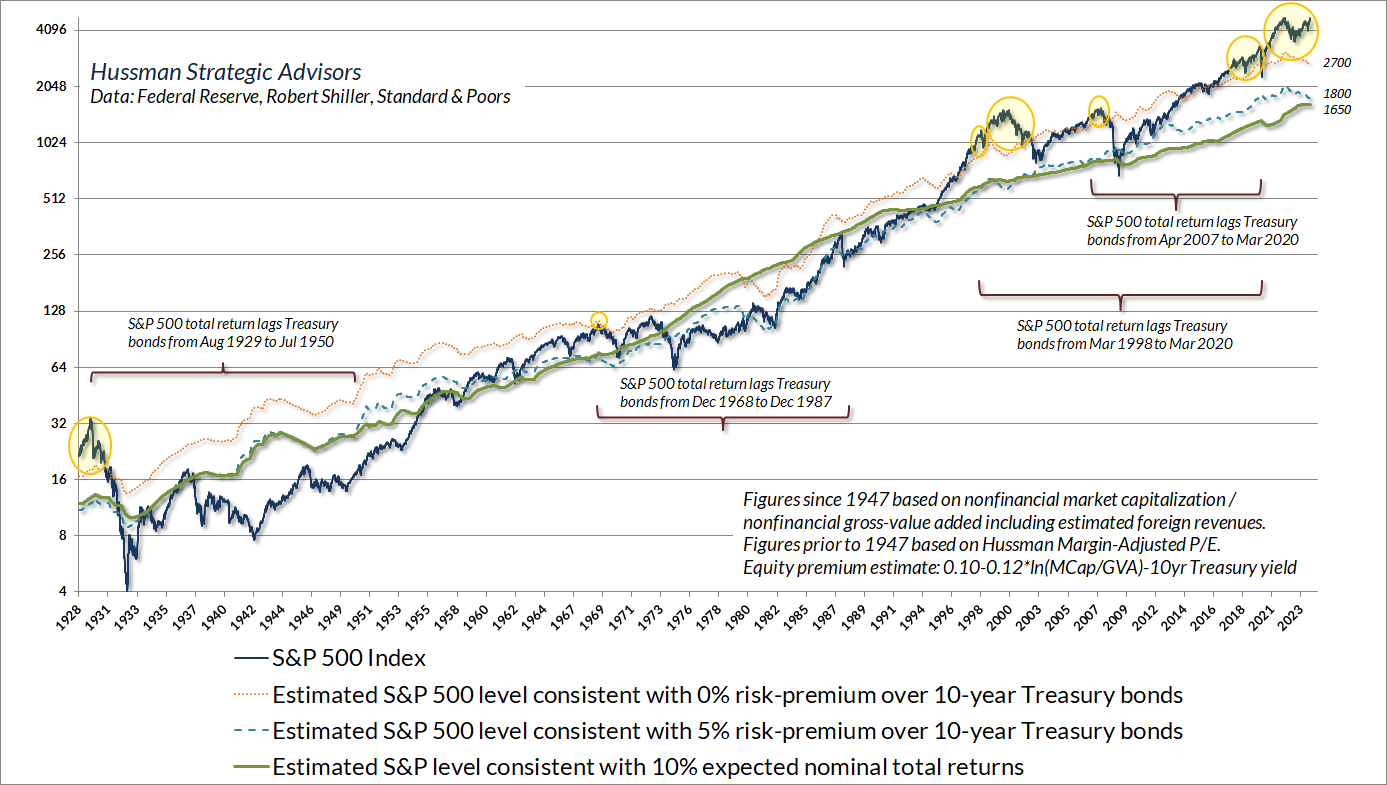
High based on overvaluation and slowing economic growth. Below is a graph from John Hussman’s January 2024 market commentary The Return of Buy-Low Sell-High. The graph shows how elevated stock market prices are. They will revert to the mean (the average growth rate over multiple decades). In the graph, the top blue line represents the current S&P 500 price. Notice how elevated it is over the other lines described below.
The green line represents the S&P 500 level of the historic average 10% return. The dashed blue line represents S&P 500 returns 5% over the 10-Year Treasury bond yield (this is the historical average “equity risk premium”).
Here is our most recent Market Valuation, which is soon to be updated.
How should you position your portfolio to weather an economic downturn?
The market volatility measure has been very low. When it is this low, it generally warns that we could have some volatility. That may be the case for the first part of the year.
For most investors who take a passive approach, review your exposure to risky investments, i.e. stocks, junkier bonds etc. Multiply the amount of risk in your portfolio (e.g. 60%) times the average bear market loss of 50% to arrive at your potential loss in a bear market (e.g. 60% risk x 50% = 30%). Assume that bonds, where bond values are lousy, will not cushion the blow that much. Now multiply that loss (in my example 30%) times the value of your portfolio. For a million dollar portfolio that is a potential loss of $300,000. Is that something you can’t stomach? Is that something that will impact your goals (e.g. retiring or sending your kids to college in x years)? If the answer to either of the above questions is “Yes” then reduce your exposure to risk. Cash (brokerage money market accounts) are paying over 5%. Cash is not a bad investment diversifier in this higher short term interest rate environment.
Need Help?
Bartley Financial is built around a client-first ethos. We are as committed to exhibiting high levels of professionalism as we are to building relationships with clients built on trust and mutual respect. That’s why we hold ourselves to a fiduciary standard. It’s also why we offer a transparent, fee-only compensation structure so that our clients never need to be concerned about a conflict of interest.
Bartley Financial has an experienced team of CPAs and CFPs® (Certified Financial Planners®) dedicated to helping clients manage their investment portfolios, plan for retirement, strategize taxes, or execute any other initiatives in pursuit of optimum financial health and minimal financial stress. From our offices in Andover, MA, and Bedford, NH, we work to ease clients’ financial concerns, strengthen their portfolios, and assuage their worry that they don’t know what they don’t know.
Contact us today to begin a relationship with a team of knowledgeable, trustworthy professionals who put their clients first.
By Robert Bartley
Robert Bartley creates the vision for the team. Everything we do centers on the clients we are fortunate to work with. Robert always says “it’s not difficult to work hard for our clients when they are such impressive people that inspire us!” Robert is also the inspiration for BFA’s work ethic which he attributes to his parents and growing up at his family’s restaurant. Robert is always pushing the team to sharpen our skills for the benefit of our clients. He is tenacious in our collective pursuit of mastery as individuals and as a team, but understands that it is a life-long journey that is never complete.