Here’s our recent Market Value Update. Looking at daily market news will drive you crazy. Instead, let’s take the long view of the current market and its value – and then ask how it affects your portfolio and what (if anything) you should do about it.
| A Quick Note Is this market downturn over? We have seen a bounce back in stocks recently. However, investors have to consider bear market rules where the weight of evidence is still negative. (Note: The S&P 500 hasn’t triggered a bear market, just a correction.) The breadth of the market is still low, yield spreads and volatility are up, which signals market turmoil. If the rally continues, then the weight of evidence could shift to positive. In down markets, especially bear markets you can experience impressive rallies. Here is evidence from the last two bear markets. • From October 2000 to October 2002, we experienced 7 rallies, before the final rally in March of 2003 which pulled us out of that long bear market. • From October 2008 to February 2009, we experienced 8 rallies, before the final rally in March of 2009 which pulled us out of that short but dramatic bear market. Stay tuned…there are a lot of headwinds with inflation, increasing interest rates and obviously the war in Ukraine. In addition, valuations are still at the highest level in history (please see the graph below). |
Valuations are extreme. The market has come down a little but still close to the highest value ever recorded based on an average of reliable market value measurements. Please see the graph below. The market value in the graph is based on the work of a Nobel Prize winner, Warren Buffet and a handful of others.
If you are getting close to a goal (needing to withdraw from your investment accounts) review your allocation to make sure you can stomach and afford to ride out the next bear market.
If you are more active with your investments, ride the wave but have your defense ready. That is our approach.
What can I learn from stock market valuation?
Well, in the short term, nothing! But in the long-term, it is amazingly predictive of where the market will be at the end of seven to ten years. It’s like knowing the answers to the test, but not the exact day it will be given.
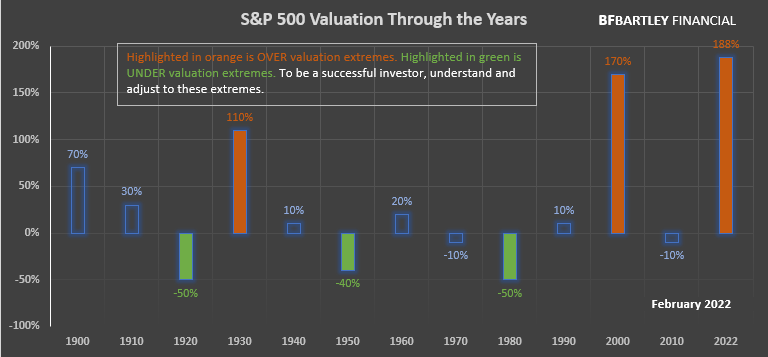
The above graph is the average of Crestmont Research, Shiller Cyclical P/E 10, Q Ratio, S&P Composite from its Regression–all geometric mean (source: dshort.com). In addition, the GMO Investment Management 7-Year Asset Class forecast for US Large Cap stock (GMO.com), Buffet Indicator (dshort.com), and John Hussman, PhD Hussman Strategic Advisors’ market value calculation, (hussmanfunds.com) were added to the average.
The graph above shows the highest overvaluation in history, approximately 200% overvalued. The average or “fair” value is 0%. Please note that one of the valuation methods included in the average is Yale economist Robert Shiller’s Cyclical P/E 10 valuation measurement, which tracks valuation back to 1871. Shiller won a Nobel Prize in 2013 for his work on asset valuation.
An easy way to ascertain stock values on your own is to review dividend yields. The average historic dividend yield for stocks is 4+%. Currently dividend yields are less than 2% for the S&P 500 index, which tells you that stocks are approximately double their fair value, which mirrors the average of the valuation measures in the graph above. Low inflation and interest rates do not justify the nosebleed prices.
How does the stock market valuation relate to my portfolio?
Stock market valuation is the BEST indicator of future stock market performance. Therefore, the current market extreme overvaluation requires a proactive strategy for your portfolio. If you will not need the money in your portfolio for many years, such as your children’s education or retirement, then you have to be less concerned than if you need the money sooner. For example, if you are within 10 years of needing the money for education or within 15 to 20 years of retirement, then you should definitely consider adjusting your portfolio allocation. Why? Because the average bear market loss is 50%. How much and when the stock market will fall is anyone’s guess. But it’s clear that the stock market will fall, or regress to the mean. Say you experience the average bear market loss of 50%, or more. I note “more” because there have been times when the bear market losses have been greater than 50%, especially for the more aggressive sectors of the economy such as technology. If you suffer a large bear market loss, how much would you need to recover? It would require a subsequent gain of 100% – or more.
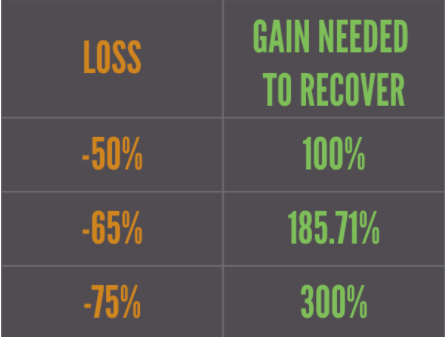
Don’t fret: if history is a guide, the market will recoup its losses and some! The stock market has easily been the best place for your money long-term. The issue is that it takes many years to dig out of the bear market hole.
So what should my investment game plan be?
The key in this market is to attempt to make money but not lose your shirt in the process. We recommend that your investment approach takes value or value extremes into consideration. You can also use the market’s momentum if you are more aggressive and have more time to attend to your investments.
The venerable Jack Bogle, founder of Vanguard, proposed allocating your current age to bonds or conservative investments (e.g. at age 50, you would have 50% in bonds and 50% in stocks or risk assets). This is a fine strategy but too simplistic when you are getting closer to your goal–when you need the money. Jack’s approach will still subject you to large losses in a bear market (e.g. 50% in stocks or risky assets x 50% bear market loss equals a 25% portfolio loss, or a $250,000 loss on a million-dollar portfolio). In addition, you will leave a lot of money (gains) on the table when you have a large allocation to bonds but the market value is low and poised for a long bull market run. Why not move your risk allocation as the market becomes overvalued and the downside risk is steep?
The goal is to protect principal but also share in the gains when an asset class (US stocks, foreign stocks, real estate, commodities, bonds, cash, and others) is performing well. Your portfolio growth will be far greater if you avoid large losses so you have more money to grow when the market provides sustainable gains. This is the case even if you experience small or no gains before the market slide. I often point out that a portfolio that experiences large gains and large losses fares much worse than a portfolio that experiences no or nominal gains at the top of a market, avoids larger losses, and then shares in strong upside rallies. *
OK, but SPECIFICALLY how do I do this? You can adjust your allocation to risk (stocks, real estate, commodities, and poor-quality bonds) based on the market over- or undervaluation. For example, if the market is 50% overvalued and your target risk is 60%, then you would reduce it to 30%. If the market is undervalued by 30% you should consider increasing your risk allocation to ~80%. Please understand, using history as a guide, when the market is at extreme highs like today the downside risk of significant loss is substantial, e.g. 60% in risk assets equals a 30% loss. However, when the market is at fair value or undervalued the downside risk is not as extreme.
The momentum option is for more aggressive investors who do not want to be as conservative in an overvalued market. Rather than reducing your portfolio allocation to risky assets, you can use the market’s momentum to ride the stock market advance until the trouble starts. You have to have strict rules on loss mitigation, such as using stop losses or comparable loss minimization techniques.
Regardless of your approach, the key is that you are disciplined in implementing it. If you rely on emotions and not on your investment discipline, you will not succeed–and you are likely to become very frustrated.
We continue to watch closely for risks and opportunities and will keep you posted.
Call us and we can help you make more sense of this, happy to help. We are believers in the free and open flow of information. We should be taught this in school. It is essential information for your life/future. Please visit our Financial Literacy page for more information on personal finance, please share it with a young person. If their parents didn’t teach them about this, they didn’t receive this necessary education!
“If everyone is thinking alike, then no one is thinking.” – Benjamin Franklin
*Past performance is not indicative of future results.